
State of the Industry: 2026 Hawaii Food Industry Report
The 2026 Hawaii Food Industry Report is a comprehensive look at the current state of Hawaii’s food and agriculture businesses based on original survey data, market research, and on-the-ground case studies. The report examines growth trends, identifies critical infrastructure and technology gaps, and outlines investment opportunities that will shape the future of the state’s food system.
Based on insights from organizations across the value chain, the report looks at the structural challenges that are limiting the sector’s potential. It looks at the industry from a data-driven perspective and provides insights into what it will take to build a more sustainable, economical, and resilient food system for Hawaii.
Download the full report
Operational challenges are compounding, not isolated
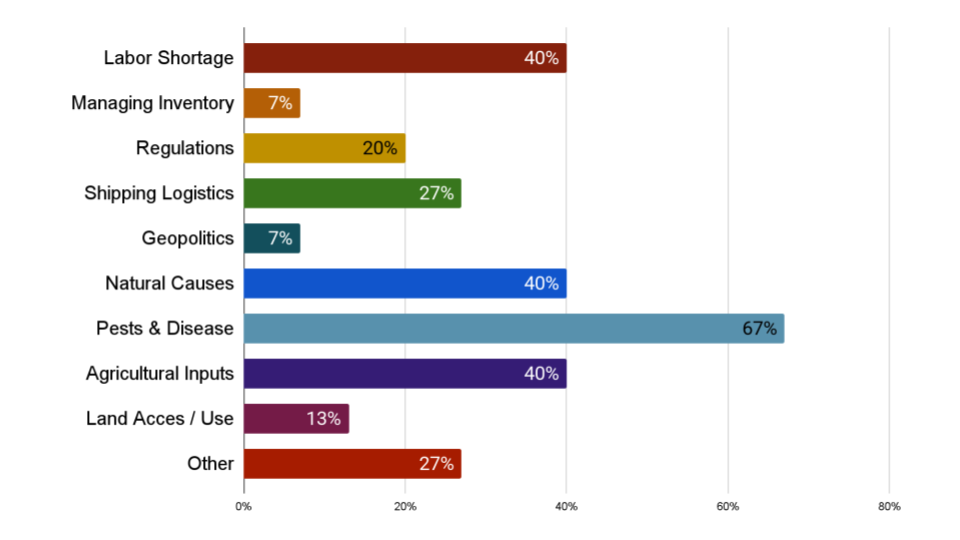
Based on the report, 67% of Hawaii’s food producers cite pests and disease as a top operational challenge, followed by labor shortages (40%), and agricultural input volatility (40%).
Among Hawaii food manufacturers, 74% cite raw material costs as a primary constraint, 63% cite labor shortages, and 47% cite supply chain disruptions.
Cost structures are dominated by labor and inputs
Labor accounts for 42% of Hawaii food manufacturer’s costs and raw ingredients account for 26%. Together, they represent 68% of total manufacturing costs for local businesses.
The majority of Hawaii food producers surveyed earn under $500,000 in annual revenue which limits purchasing power and keeps per-unit costs elevated.
Supply chains are fragile and costly
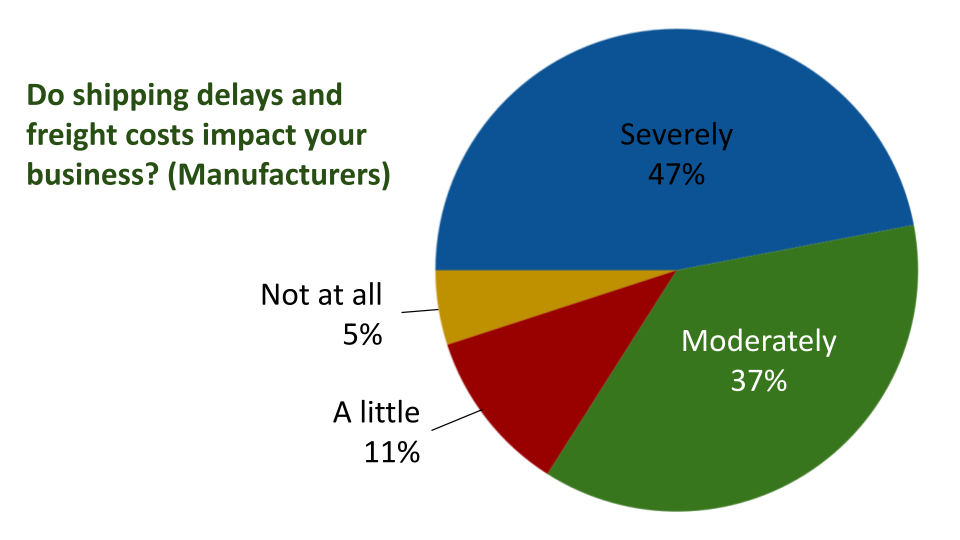
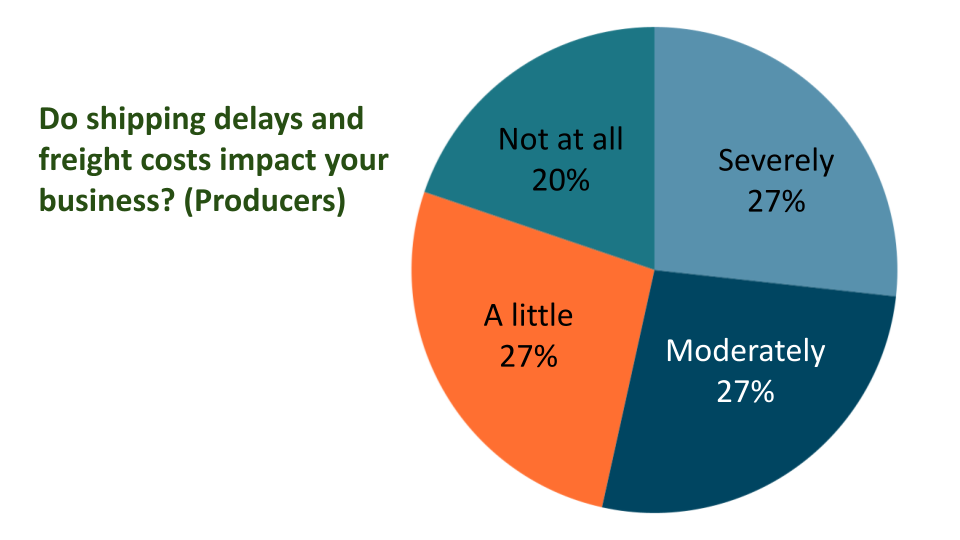
80% of Hawaii food producers and 84% of food manufacturers report that shipping delays and freight costs have a moderate to severe impact on their business.
While 87% of Hawaii food producers source inputs locally, 33% still depend on the U.S. Mainland for critical inputs.
Hawaii food manufacturers are even more exposed to supply chain risk: 97% source locally, 76% also source from the U.S. Mainland, and 26% source internationally.
Technology adoption is the industry’s biggest untapped leverage point
Approximately 57% of Hawaii food producers use no technology in their operations.
Only 6% of Hawaii food manufacturers use ERP systems and only 6% use cold chain monitoring which leaves sales, inventory, production, and distribution data disconnected.
Market access has been achieved but operational readiness is holding the industry back
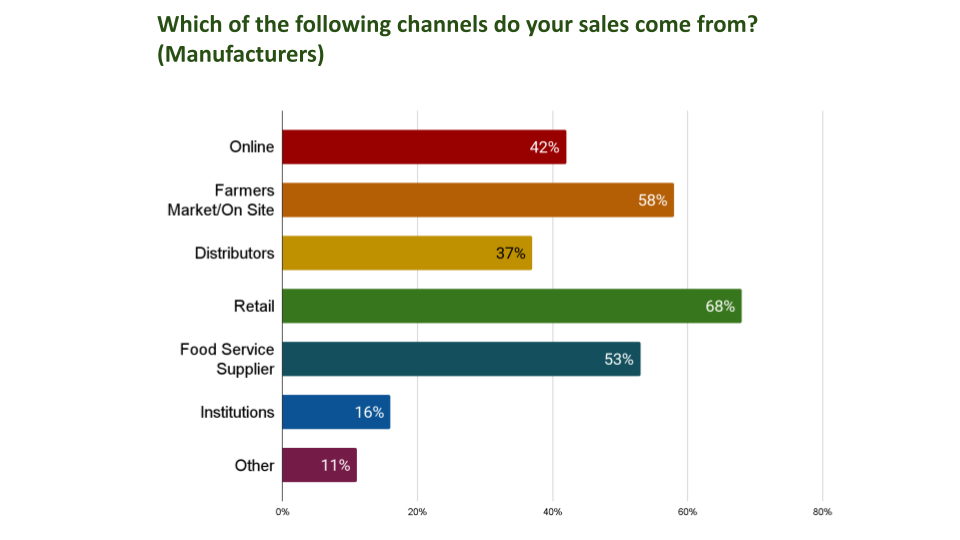
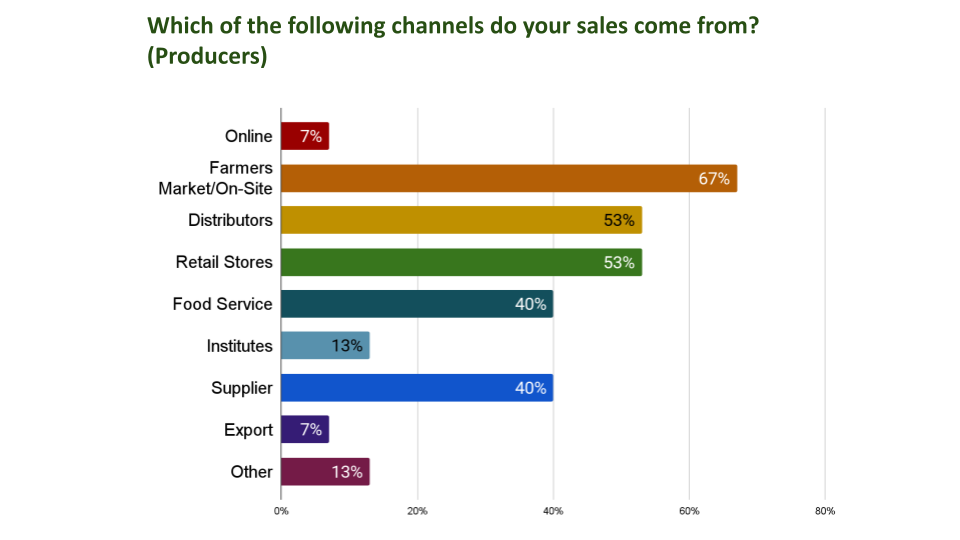
67% of Hawaii food producers sell direct-to-consume through farmers markets, while manufacturers report broad channel access: 68% in retail, 53% in food service, and 42% online.
77% of Hawaii food manufacturers report year-over-year growth but that growth comes from increased volume rather than efficiency gains.
Hawaii’s food sector is approaching an inflection point where future growth will depend on operational maturity rather than increasing market demand.
“We waited 2.5 years to get a permit to replace already existing sinks in our new facility. Over those 2.5 years we almost went broke.”
What are local businesses saying?
Our survey included an open-ended survey response section that surfaced eight main recurring themes: freight costs and the Jones Act, permitting and regulatory friction, shared infrastructure needs, water security and pest management, capital access and tax policy, workforce development, land access, and market development.
“Food manufacturers need real assistance with ‘freight in’ and ‘freight out’ costs. They should be able to operate tax-free — if the government is really serious about growing sustainability.”
“I would like to see a trade show for local vendors promoted nationwide, not a cash and carry show, but one only for wholesale buyers.”
“Regional infrastructure for food hubs to aggregate and process. Technology and equipment sharing.”
“Value-added retailers are raising prices, but they are not passing on increases to small farmers.”